5 Simple Things Every Business Can Track in Google Analytics

Learn 5 simple Google Analytics metrics that help you understand traffic, behavior, and performance without getting overwhelmed.
Start Understanding Your Website
Most business owners have a website, but don’t really know what it’s doing. They’re guessing:
- Where traffic is coming from
- What people are looking at
- Why they’re not getting leads
That’s where Google Analytics (GA) comes in. The problem is, most people log in to GA once, get overwhelmed, and never go back. The key here is that you don’t need to track EVERYTHING. You just need to track the RIGHT THINGS. Let’s take a simple look…
1. Traffic (How Many People Are Visiting)
This is your starting point. How many users are coming to your site? Is that number trending up or down?
If your traffic is low, your issue may be visibility (people are just not finding you online). If traffic is steady to your website, but you’re not really getting any leads, your issue is your website. This metric helps you separate those two problems quickly.
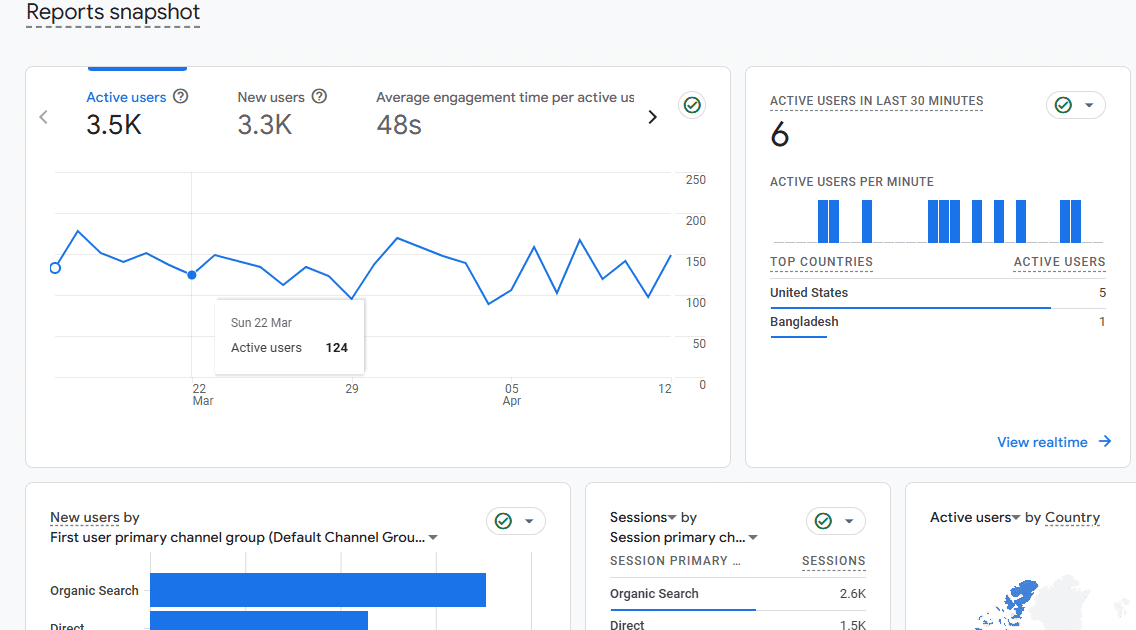
2. Traffic Sources (Where They’re Coming From)
This shows how visitors are actually finding you or getting to your website. Look at:
- Organic (through Google search)
- Direct (direct typing your URL)
- Referral (from other websites)
- Social
These numbers tell you what’s working. For example: If you’re investing in SEO or paid ads but everything shows up as “Direct,” something isn’t set up correctly or being tracked properly. On the flip side, if Organic traffic is strong, that tells you your SEO is doing its job.
3. Top Pages (What People Actually Care About)
Not all pages are equal. What pages get the most traffic? Where are people landing first? This gives you real insight into what your audience is interested in.
If your homepage is getting all the traffic but your service pages aren’t, you may need to tweak your messaging. If you see certain pages showing high traffic, you may want to pay extra attention to the layout and messaging of those pages.
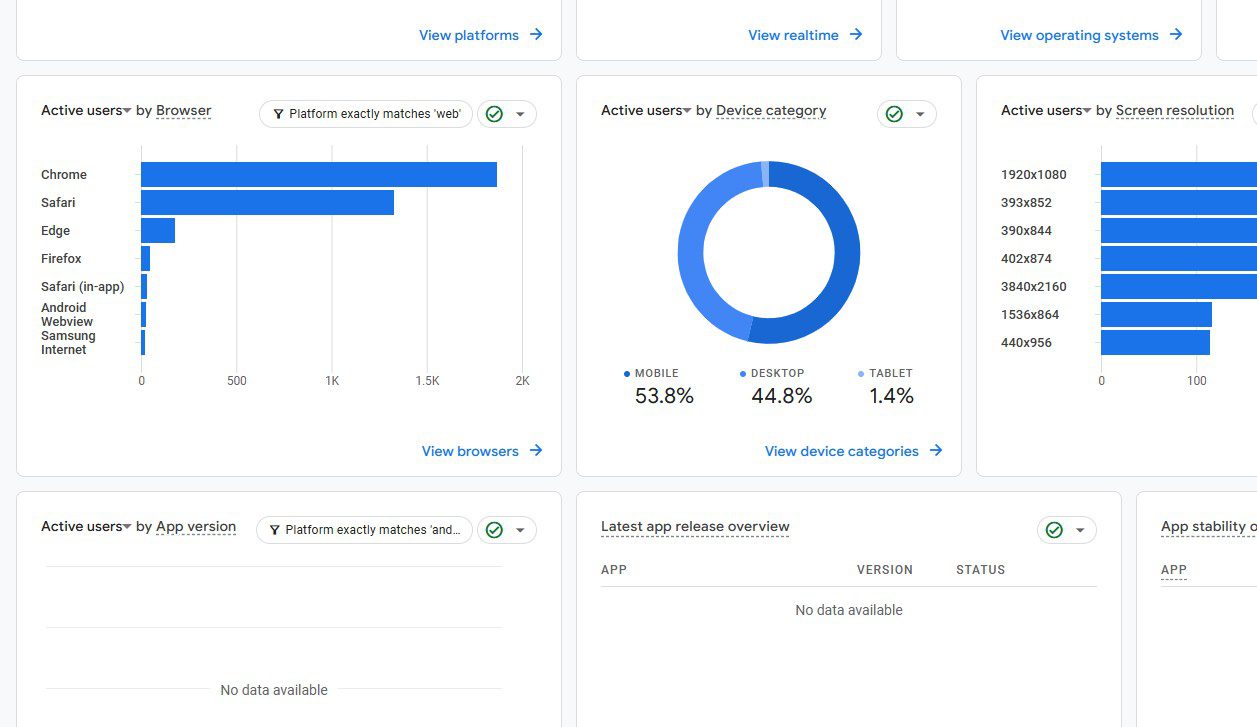
4. Device Type (How People Are Viewing Your Site)
This one gets overlooked, but it matters. Look at:
- Mobile
- Desktop
- Tablet
A lot of websites see 60–80% of traffic coming from mobile. In these cases, if your site looks great on desktop but is hard to use on a phone, you could be losing opportunities. On the flip side, a lot of B2B websites see more traffic coming from larger desktop environments. In those cases, you would typically want to focus on a large, engaging layout.
These numbers can also helps guide design/UX decisions like:
- Button sizes
- Overall layout
- Load speed priorities
If you don’t know how people are viewing your site, you’re kind of designing blind.
5. Engagement (Are People Sticking Around?)
This metric tells you how users interact with your site. Look at:
- Engagement time
- Bounce rate
If people leave quickly, something isn’t connecting. Either your messaging is off, design is confusing/doesn’t inspire, or pages are loading too slow. This is where you start diagnosing real problems instead of guessing.

BONUS: Conversions (Are People Taking Action?)
This is the most important metric, but it’s a bit more advanced and needs to be set up properly. You can track things like:
- Contact form submissions
- Phone clicks
- Quote requests
These types of actions are what actually proves your site is working or generating business for you. If these numbers are healthy, there is a good chance your website is working really well for you.
Keep It Simple
You don’t need to become an expert in Google Analytics. If you consistently check these 5 areas, you’ll understand what’s working, spot problems faster, and make better decisions to get more out of your website.
Want Help Understanding Your Data?
If you’re not sure what your numbers are telling you, let us give you a hand. At Vector Web Solutions, we break this down into simple insights so you can use your website to grow your business. Contact us today!